If you want to develop a website that has an interactive map on it, there are plenty of options you can choose from. Google and Bing maps are obvious choices, but both of them have a cost associated with them, which may be excessive, especially if you don’t intend to use your website as a commercial product. However, there are several free alternatives that, for many use cases, just as good as the APIs provided by either Google or Bing. Once of such map APIs is OpenLayers.
All of these map providers fall under a software category known as GIS. GIS (which stands for Geographic Information System) is a type of software that provides geographic information, while also giving you the ability to associate non-spacial data with locational attributes. For example, a point on a map may hold a whole collection of attributes, akin to a row in a standard database table.
Another example would be a public road, as represented by a multi-point line, having a whole set of traffic-related attributes, such as direction and speed limit. Connecting several of such roads into a network would allow you to calculate the route and estimated time from one point to another, as it is possible on Google and Bing maps.
This functionality, along with other spatial computation capabilities, can be performed by absolutely any types of GIS, so you don’t really have to use the ones provided by the major tech companies. The problem with it is, however, that any specific functionality that you would want to implement may not yet be documented, so you will have to figure out how to do it yourself.
As great as OpenLayers is for displaying maps on your web page, it does lacks official documentation for some of the most common use cases. The developers behind it were very generous and have provided many examples, but there are some common use cases that are still missing (at least, at the time of writing). One of such use cases is the ability to display a clickable marker on the map that, when clicked, opens up a modal dialog with more information about the location. And this is precisely what we will talk about in this tutorial.
Code sample
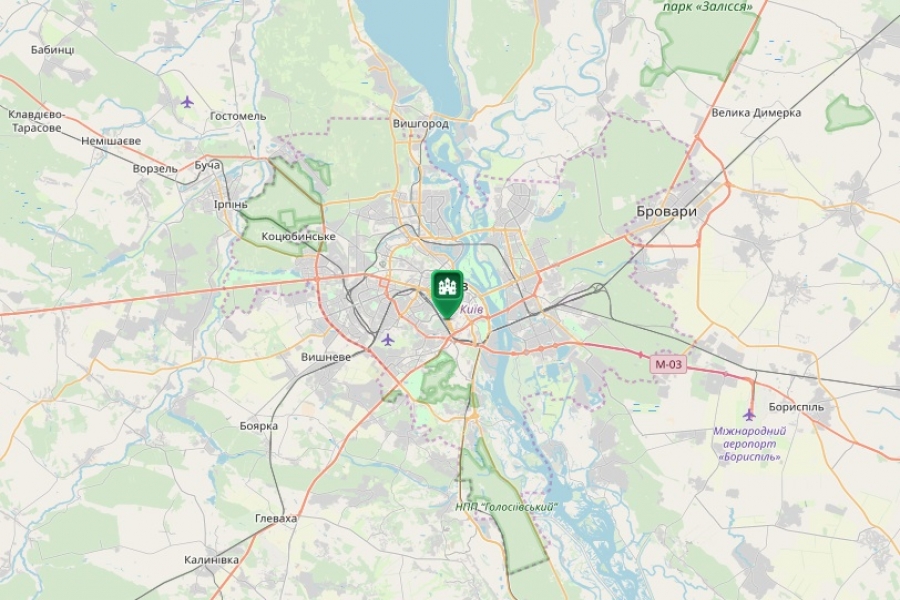
The sample web page that I have developed for this tutorial can be found via a link below. I have decided to use one of my favourite restaurants in Kyiv, Ukraine called Odessa (which serves the best seafood ever). The map already has a marker at the restaurant’s location. If you click on it, a modal dialog will appear with more information.
OpenLayers clickable marker example
To get the actual markup and the code for that page, you can navigate to the page, right-click on it and click “View Source”. Alternatively, you can copy the code and markup from the following page:
OpenLayers example markup and code
You would just need to save it into a text file, give it an extension of either “.html” or “.htm” and you are set to go. All dependencies in the code are available over the web, so you can run it on your machine simply by opening the file in your favourite browser.
The code explained
Initially, the shell of the webpage was taken from the official OpenLayers Getting Started page, which, at the time of writing, looked like this:
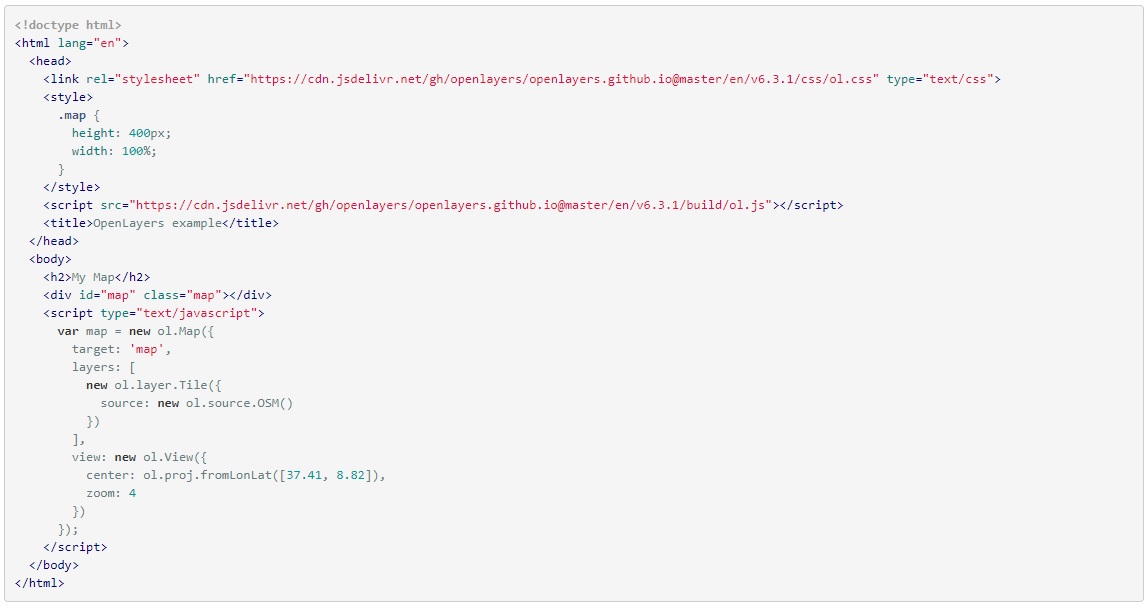
This gives us just a basic map with just a single layer taken from OpenStreetMap. You can see this in the JavaScript on the page, where “map” variable is being set.
First, the variable is initialized as an object of a type “ol.Map” which is taken from the OpenLayers JavaScript library that we reference as “ol.js” file.
Then we set the “div” element with both class and id set as “map” as the target for the map. This means that the map will be displayed inside the bounds of this element within the markup. This is why, if we launch the page in the browser without any modifications, your map will be displayed only in the top portion of the screen. After all, the “style” element on top of the page contains CSS where the height of any element on the page that has its class attribute set as “map” is restricted to 400 pixels. In our example, we have changed it to 100% to get a full-page map.
Going back to out “map” variable. Any GIS software has a concept of layers, which are various visible geographical data types stacked on top of each other. With OpenLayers library, the order of layers is defined bottom top to the top. So, if we had a non-transparent image as our last item in the array within the “”layers” field of “ol.Map” object, we wouldn’t be able to see anything else. The proper usage of this hierarchy is to have a non-transparent image as the first item of the array (which would also be known as base map), while having points, lines, polygons and other localized features after it. In the original implementation, base map is the only layer we have, and it comes from OSM, which stands for OpenStreetMap.
Finally, we have our initial state of the visible map set by the values we put into “view” field. This is where we set the initial center point of the map and the zoom level.
Adding modal dialog
Before we will start, we will need to be clear what modal dialog is, as I realize that not everyone who will be reading this article is an experienced web developer. Modal dialog is nothing more than a pop-up that can appear on top of your web page, while remaining a part of your page. Once you close the page or navigate away from it, the modal dialog will be gone.
A modal dialog can have any type of markup the page can have, such as images, text, links, videos, etc.. So, it’s more than just a message box. As we got this out of the way, let’s add a basic modal dialog to our page.
Bootstrap is arguably the best framework for enabling modal dialogs. However, as teaching Bootstrap is beyond the scope of this tutorial, we will just use vanilla HTML, CSS and JavaScript without any additional libraries.
A good example on how to create a basic modal dialog without additional dependencies is provided on this page. And this is what we have based our own modal on.
First, we will add CSS to our page to style the modal. Normally, we would do it in a separate file, but for the sake of providing a convenient example, we will place our CSS inside the “style” element on our page. In our example, everything under the styling for “map” class is related to modal. This is how we control the size, overlap and initial visibility of our dialog.
Explaining what most of the values are is beyond the scope of this article and there are many good tutorials available online if you want to learn more about CSS. However, the line that says “display: none;” is useful to understand, as this is the value we will be changing with our JavaScript to display and hide the dialog.
The markup for the modal dialog is denoted by the following lines:
<!-- The Modal -->
<div id="myModal" class="modal">

<!-- Modal content -->
<div class="modal-content">
  <span class="close">×</span>
  <h2>Odessa Restaurant, Kyiv</h2>
  <img src="https://media-cdn.tripadvisor.com/media/photo-s/04/49/ca/08/odessa-restaurant.jpg" />
  <p><a href="https://odessarest.com.ua">Click to find out more</a></p>
</div>
And we have the following JavaScript to close the modal dialog either when the user clicks on the cross in the corner, or when the user clicks anywhere outside the modal:
   var modal = document.getElementById("myModal");
   var span = document.getElementsByClassName("close")[0];

   span.onclick = function() {
    closeModal();
   }

   // When the user clicks anywhere outside of the modal, close it
   window.onclick = function(event) {
    if (event.target == modal)
     closeModal();
    }

   function closeModal() {
    modal.style.display = "none";
   }
Ignore “coordinates” variable for now. It’s related to the point that we are interested in and not the modal dialog.
Placing a point on the map
In GIS terminology, and visible vector data that is placed on the map, such as a point, a polygon or a line, is known as feature. A feature is not a mere drawing, but is also has tabular data associated with it, akin to an entity in a SQL database table.
And OpenLayers is not an exception. If you want to place a point on the map, you need to create a feature and give it a point as its geometry type. In our example, this is achieved by the following code:
   var iconFeature = new ol.Feature(new ol.geom.Point(ol.proj.fromLonLat(coordinates)));
   iconFeature.setId('moonlight');
   iconFeature.set('style', createStyle('https://openlayers.org/en/latest/examples/data/icon.png', undefined));
This is where we are using our “coordinates” variable defined earlier. Please note that calling “ol.proj.fromLonLat()” while passing the array of coordinates to it is important. Before we call this function, our coordinates are just arbitrary numbers. This function reads them as Longitude and Latitude values respectively and converts them into valid projected coordinates.
Please note that the image for the marker is set via a web link to one of the examples provided by OpenLayers. Of course, this could be a local file instead, but I have chosen to use a publicly accessible URL to keep all the code in a single file.
Of course, a point is useless unless you define how it’s displayed. This is why we have this function, which we call when we set style for our feature:
    function createStyle(src, img) {
    return new ol.style.Style({
     image: new ol.style.Icon(({
      anchor: [0.5, 0.96],
      crossOrigin: 'anonymous',
      src: src,
      img: img,
      imgSize: img ? [img.width, img.height] : undefined
     }))
    });
   }
Finally, we need to add our feature to the layer on the map. We do this by adding the following value to the array of layers inside our “ol.Map” object:
new ol.layer.Vector({
      style: function(feature) {
       return feature.get('style');
      },
      source: new ol.source.Vector({features: [iconFeature]})
     })
As we have covered before, this will place the feature layer containing the marker on top of our base map.
Making the point clickable
We now have the code for the marker on our page set at the correct coordinates and the code for our modal dialog, which is currently hidden. Let’s now bring the two together and enable the visibility of the dialog to be toggled when the marker is clicked. To do so, we have added this code:
 map.on('click', function(event) {
    map.forEachFeatureAtPixel(event.pixel, function(feature,layer) {
     if ( feature.getId() == "moonlight" ) {
      modal.style.display = "block";
     }
    });
   });
Let’s quickly go over what it does. In OpenLayers, it is not possible to associate mouse events with individual features on the map. This is why we have to associate a “click” event with an entire “map” variable that includes all layers and all features of the map.
However, once the “on click” event has been fired, we can go through all features at the pixel that the mouse was pointing at during the event and check whether a specific feature exists at that location by looking up a specific value of id attribute that we have given to the feature. Once we have verified that the feature we are interested in exists at that screen location, we can execute an appropriate action. In our case, we are changing the display style of the modal dialog from “none” to “block”, which makes it visible.
Finally, we need to give the user a hint that the marker is clickable by changing the mouse cursor into a hand with a pointed finger (which is correctly defined as “pointer”) when the user hovers over it. We do so via teh following code:
   map.on('pointermove', function(evt) {
    map.getTargetElement().style.cursor =
     map.hasFeatureAtPixel(evt.pixel) ? 'pointer' : '';
   });
Final remarks
This article has provided one of the possible ways of enabling modal dialogs on pages with OpenLayers maps. However, this specific way may not be suitable for all scenarios and all experience levels.
Almost any modern JavaScript library and framework can be downloaded via NPM these days and OpenLayers isn’t an exception. And there are many advantages of doing so. For example, by referencing the entire “ol.js” file, we have made our code download the entire OpenLayers framework, even though we only need a small part of it. With NPM, we could have made our own code more modular and only import into it those classes from OpenLayers that we needed. This would have reduced both page load times and page size.
However, there are several reasons why I have chosen the approach I have chosen. First of all, by referencing the whole framework, I can keep my code on a single page that can be opened by any browser. Secondly, I intended my code to be understood by both experienced and novice web developers. An experienced web developer would be able to easily make the necessary changes to get all of the necessary references via NPM. After all, NPM, and Node.js that it’s part of, is something that any experienced web developer shouldknow. A novice web developer or a person who does web development casually, on the other hand, would just be overwhelmed with information. This is why I have opted to use the approach that may not be the most efficient performance-wise, but is the easiest one to explain.
Another point is that in a real life scenario, things like coordinates and the content of the modal dialog (text, image, link, etc.) would not be hard-coded in the page and would instead come from a back-end database. The markup of the dialog itself would still be the same. Its content, however, would be extracted from a back-end data store and inserted into the markup by JavaScript.
This goes back to the data that you can associate with any given GIS feature. Once you click on a specific feature, it’s the data that is associated with that specific feature that will fill the pop-up dialog. The exact mechanism of this, however, is beyond the scope of this article. This is what I intend to write about in the near future.
I have made my best effort to explain it as clearly as I can. However, if you feel that the explanation wasn’t clear enough, please leave the comment below and I would add some more details if necessary.